A reliable full-name meaning has not been established here. The recorded Irish and English forms are given without an unsupported translation.
Recorded forms
Luimneach· Irish · main form · validated name
Limerick· English · main form
Place & story
A city on the Shannon
Lewis’s 1837 directory introduces Limerick as a city and county of itself on the Shannon. It separates the population of city and suburbs from that of the larger rural district included in its jurisdiction. That distinction is essential when using an old population total. It also shows why a person described as living in the “county of the city” need not have lived in the closely built urban centre.[2]
A maritime and royal centre
The historical narrative describes Norse settlement and a maritime station, followed by relationships with the rulers of Thomond. It associates later royal residence with Limerick after Cashel’s transfer to ecclesiastical use. Several kinds of community occupied the same strategic place over time.[2]
People & connections
Catherine Hayes of Patrick Street
Opera singer Catherine Hayes was born at 4 Patrick Street on 25 October 1818. Her baptism at St Mary's Cathedral provides another precise local connection. In 2018 the city marked its bicentenary through exhibitions, performance and archival material. The Opera site redevelopment took its name from her association with the area. Her story adds music and international performance to a city often introduced through castles and sieges, while keeping the connection anchored in a particular house and church rather than a broad county claim.[3]
The fortnight of the Soviet
In April 1919 Limerick experienced a general strike following military restrictions imposed after a violent attempt to free prisoner Robert Byrne. The trades council's strike committee, nicknamed the Limerick Soviet, controlled prices, distributed food and organised essential services during the stoppage of 14–26 April. It also issued its own paper money and a newspaper. The museum's account makes clear that the name referred to a local workers' committee during a specific crisis. These practical actions show how labour organisation could briefly alter the everyday government of an Irish city.[4]
Limerick city and suburbs — Census 2016 settlement footprint
Population within 2016 settlement boundaries
103,611people · 2022
Both counts use the 2016 settlement boundary, allowing like-for-like comparison. CSO supplies the 2022 count on this older boundary for comparison only. The official 2022 Built Up Area has different boundaries.
View population figures
Limerick city and suburbs — Census 2016 settlement footprint — census population
Limerick City, Limerick — City administrative area, CSO 2006 report
2002–2006: city administrative area
52,539people · 2006
These are the historical areas published in the 2006 census report. Boundaries may differ between censuses and from modern settlements. Legal towns, environs and suburbs are shown separately; none has been combined into a modern settlement total.
View population figures
Limerick City, Limerick — City administrative area, CSO 2006 report — census population
Limerick Suburbs, Limerick and Clare — City suburbs only, CSO 2006 report
2002–2006: city suburbs only
38,218people · 2006
These are the historical areas published in the 2006 census report. Boundaries may differ between censuses and from modern settlements. Legal towns, environs and suburbs are shown separately; none has been combined into a modern settlement total.
View population figures
Limerick Suburbs, Limerick and Clare — City suburbs only, CSO 2006 report — census population
Limerick City, Limerick — City administrative area, CSO 1996 report
1991–1996: city administrative area
52,039people · 1996
These are the historical areas published in the 1996 census report. Boundaries may differ between censuses and from modern settlements. Legal towns, environs and suburbs are shown separately; none has been combined into a modern settlement total.
View population figures
Limerick City, Limerick — City administrative area, CSO 1996 report — census population
Limerick Suburbs, Limerick and Clare — City suburbs only, CSO 1996 report
1991–1996: city suburbs only
27,098people · 1996
These are the historical areas published in the 1996 census report. Boundaries may differ between censuses and from modern settlements. Legal towns, environs and suburbs are shown separately; none has been combined into a modern settlement total.
View population figures
Limerick Suburbs, Limerick and Clare — City suburbs only, CSO 1996 report — census population
Limerick, Limerick — City administrative area, CSO 1986 report
1981–1986: city administrative area
56,279people · 1986
Figures cover the historical town area printed in the 1986 report. Boundaries may have changed between censuses. Legal town, environs and suburb totals remain separate and differ from modern settlement boundaries.
View population figures
Limerick, Limerick — City administrative area, CSO 1986 report — census population
These figures use different area definitions. Read the boundary note before comparing them.
Limerick city and suburbs, Limerick
Published census settlement populations
94,192people · 2016
Settlement boundaries changed during this period. Differences may reflect boundary changes as well as population change. Where a 2011 legal-town-and-environs count is shown, it has not been recalculated onto the 2016 settlement boundary.
View population figures
Limerick city and suburbs, Limerick — census population
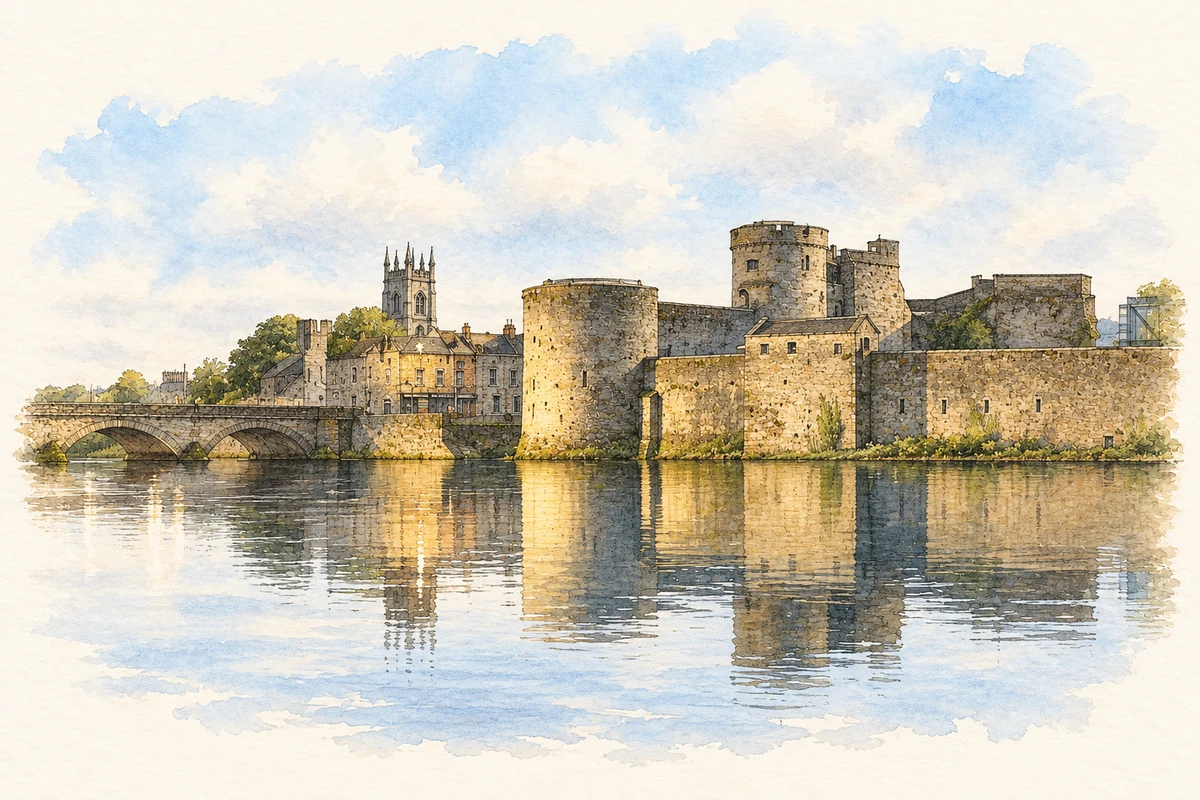
King John’s Castle illustration: based on a reference photograph by Claire WatersLulu. AI-assisted watercolour and ink adaptation; warm cream paper margins; incidental modern clutter removed and fine details simplified. Licence: CC BY-SA 4.0.
 placenames